News
Google's win probability. How it's calculated and where the numbers come from
Updated 30 July 2026
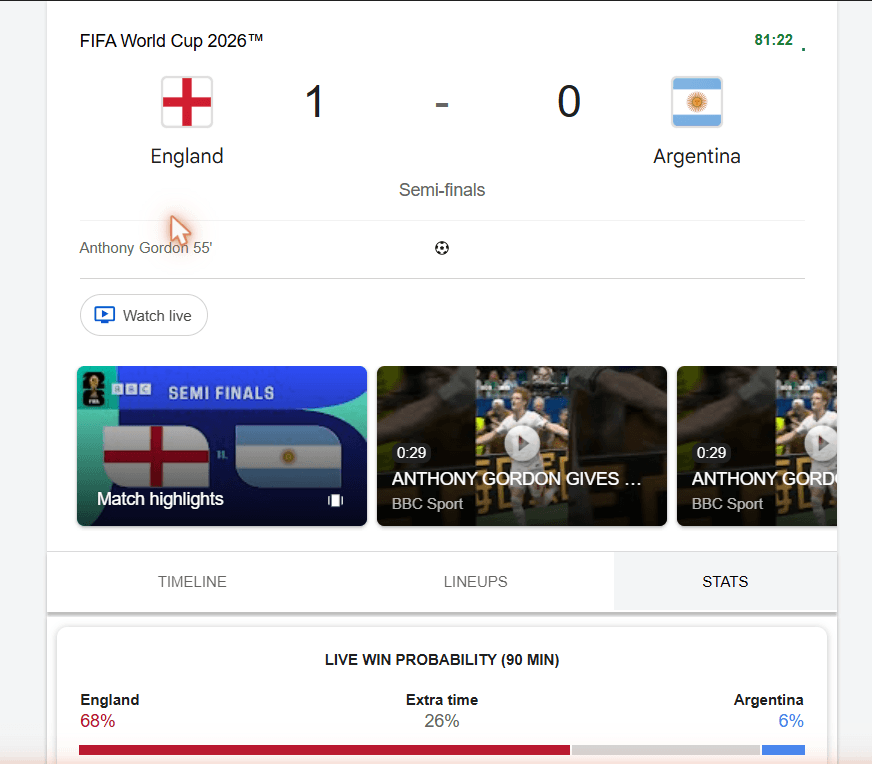
Google's win probability widget gave Argentina a 6% chance in the 83rd minute of tonight's World Cup semi-final in Atlanta. Nine minutes and two goals later, Argentina had beaten England 2-1 inside regulation. We watched the whole swing from the browser's network tab, so this is a close look at the box millions of people argue with during big matches. What reaches your screen, how often it refreshes, how the percentages get calculated as far as anyone outside Google can tell, and what Google keeps sealed.
- Match
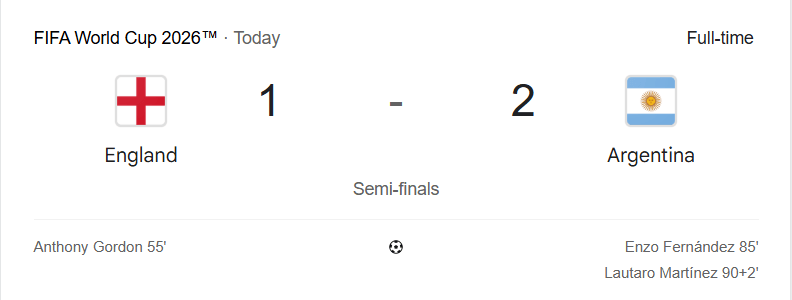
- England 1-2 Argentina, FIFA World Cup 2026 semi-final, Atlanta, 15 July
- Goals
- Gordon 55'. Fernández 85'. Martínez 90+2'
- Widget at 83'
- England 68%, extra time 26%, Argentina 6%
- Endpoint
google.com/async/lr_mt_fp- Refresh
- Every 20 to 30 seconds while the match is live
What the widget actually receives
The win probability box is fed by a single async endpoint, google.com/async/lr_mt_fp, which appears to stand for live results, match tab, full page. Each response identifies the fixture by its Knowledge Graph id and carries the entire stats tab. Here is the probability block exactly as we captured it in the 83rd minute, trimmed only for width.
[[["68","6","26"]],
 "Live win probability (90 min)",
 ["England","#B8142D","ENG"],
 ["Argentina","#4285F4","ARG"],
 ["Extra time","#D6D6D6","Extra time"]]
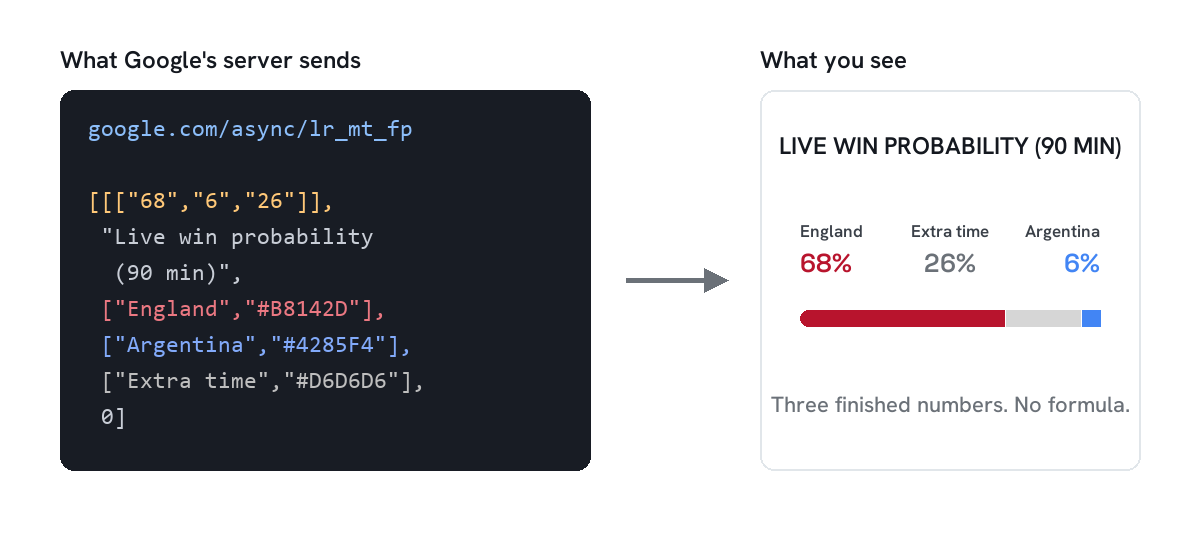
Three finished numbers, two team labels, three hex colours. That is the whole widget. The same payload carries the shot counts, possession, and corners, equally pre-baked, along with refresh values of 20, 30, and 60 seconds that match the polling we watched. While the match ran, the page re-requested the endpoint on that cadence and the bar moved.
People search how is this calculated while the bar is on screen. Nothing in the browser holds the answer. The calculation happens upstream, and only the result ships.
Two absences matter more than anything present. There is no formula and no input data, so the calculation cannot be reverse-engineered from the client side. And there is no attribution anywhere. Every request on the results page goes to google.com or gstatic.com, with no bookmaker feed, no stats vendor, no third-party call at all.
One reading note. Extra time is Google's label for a draw at 90 minutes in a knockout tie. So the 6% was never Argentina's chance of reaching the final. It was the chance they would win in regulation. They did.
Where does Google get win probability data
Match predictions from Google have a documented ancestor but no documented present. Google has never explained the live widget, and questions in its own support forums about how the percentages work sit unanswered. What is on the record is the provenance. In 2014 a Google Cloud team built a World Cup prediction model on Opta touch-by-touch data with a logistic regression predictor, open-sourced the notebook, and tracked its record publicly. Reporting at the time credited it with 14 of 16 knockout matches, including a 55% call on Germany in the final, while Bing went 15 of 16 using the betting-market data Google avoided. A win-draw-lose panel then appeared quietly on Premier League searches from August 2014. Google has never said whether today's system descends from that notebook, so treat 2014 as lineage, not a spec.
The method itself is standard in football analytics. Stats Perform, the company behind Opta, describes its own live win probability model as simulating the remainder of a match thousands of times, weighing team quality from roughly four years of results, recent form, home advantage, the current score, time remaining, chance quality, and red cards. That class of model is what live percentages like these look like in practice. Whether Stats Perform, another supplier, or an in-house pipeline feeds Google's version is undisclosed.
Was the 6% wrong
No. A 6% chance lands about once in sixteen tries, and this was that time. Fernández equalised two minutes after the payload we captured, and Martínez finished it in stoppage time. The bar shows what a sealed model believed at that minute, not what was going to happen. Judging a probability by a single outcome is the oldest mistake in football arguments, and tonight will fuel a few million of them.
Why we watch sealed widgets
Sealed, precomputed answers now hold the best real estate on the results page. Nobody clicked through to a sportsbook or a stats site to see those percentages. Google answered the query inside its own panel, with a model nobody outside can inspect, and the search never left the page.
Brand questions work the same way now. When a player asks Google or an AI assistant whether a casino is legit, the verdict arrives just as finished as that 6%, assembled upstream from sources the brand may not control. Pipelines like these cannot be reverse-engineered from the outside. What a brand can control is the inputs, the pages, profiles, and mentions the models read. That is the work we do.
Frequently asked questions
How does Google calculate live win probability?
Google has never published how the live numbers are calculated. The widget receives three finished percentages from Google's servers and re-polls every 20 to 30 seconds during a live match. Documented models of this kind simulate the rest of the match thousands of times using team strength, form, the score, time remaining, chance quality, and red cards.
Where does Google get its live football match data?
Undisclosed. The payloads carry no attribution and the page calls no third-party service. Google's open-sourced 2014 predecessor ran on Opta data, but nothing on the record confirms what feeds the current panel.
Do Google's win probabilities come from betting odds?
No evidence supports that. The captured payloads contain no odds fields, and Google's documented 2014 model deliberately avoided betting-market data, while Microsoft's Bing used it that year.
What do sealed answers say about your brand
We audit how iGaming brands appear across Google's panels and AI answers, find the sources those systems actually read, and fix what they say.
Book a brand check or email hello@whitelobby.comNew here. See how we help iGaming brands take control of their brand SERP and AI answers, or read our research on how AI answers treat payment brands.